

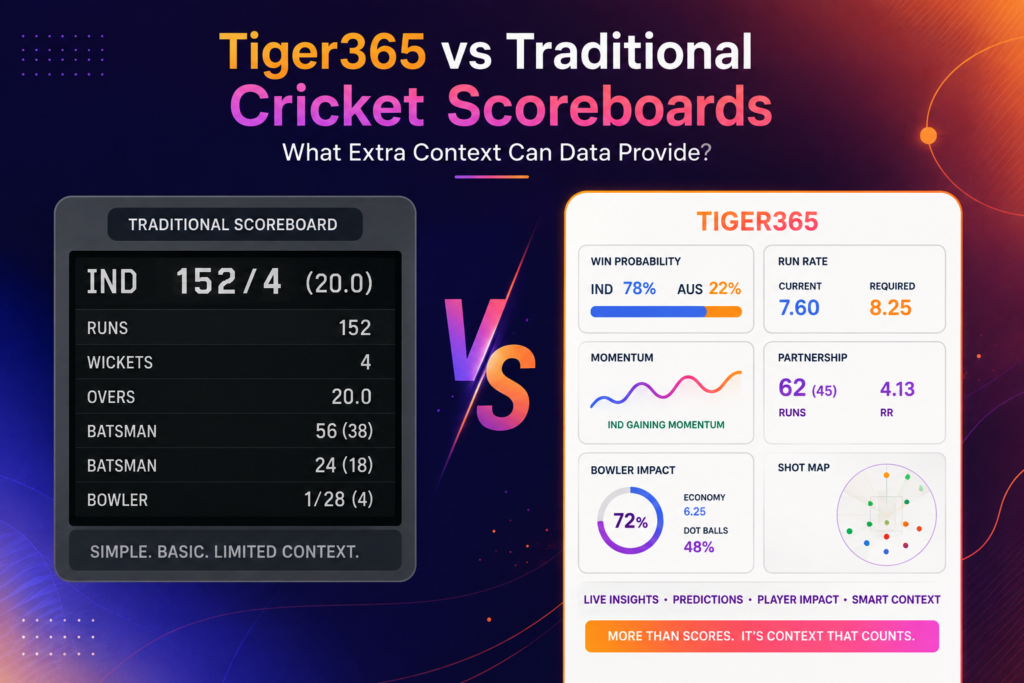
A cricket scoreboard gives fans the essential details of a match, including runs, wickets, overs, current target, and individual performances. However, understanding why the game is changing requires more than simply looking at the score. This is where deeper cricket data can provide valuable context.
The Tiger365 takes a data-focused approach to the modern cricket experience, where live match information can be viewed alongside important performance metrics. Instead of focusing only on the current score, cricket fans can consider factors such as run rate, strike rate, partnerships, bowling economy, required run rate, and changes in match momentum.
The traditional scoreboard remains the foundation for following a game, while a broader data view helps explain the story behind those numbers. For fans interested in understanding live cricket more closely, Tiger365 can be part of this modern approach to following match statistics and performance information.
Traditional Scoreboards: The Starting Point
The traditional cricket scoreboard remains one of the easiest ways to follow a match.
It normally shows information such as:
- Total runs
- Wickets
- Overs
- Individual batter scores
- Balls faced
- Fours and sixes
- Strike rates
- Bowling figures
- Economy rates
- Target and required run rate
These numbers are extremely useful. For example, a batter’s strike rate indicates how quickly they are scoring, while a bowler’s economy rate shows how many runs they concede per over.
However, individual numbers do not always explain the complete situation.
A batter scoring 40 from 30 balls may look impressive at first glance. But whether that innings was valuable depends on the match situation, wickets remaining, required run rate and the team’s scoring rate at that point.
This is where context becomes important.
What Does “Extra Context” Mean in Cricket Data?
Extra context means looking beyond individual numbers and asking how those numbers relate to each other.
For example:
Score: 145/5
Overs: 18
Required Rate: 13.5
Set Batter: 65 from 40 balls
A basic scoreboard tells you the numbers.
A deeper analysis asks:
- How quickly did the team score during the last five overs?
- When did the wickets fall?
- Is the current batter scoring faster or slower than the team’s required rate?
- How many runs came from boundaries?
- Did the scoring rate increase after a bowling change?
- Is the chasing team losing wickets while trying to accelerate?
- Which partnership has contributed most to the innings?
These questions transform raw statistics into match context.
Tiger365 vs a Traditional Scoreboard
The biggest difference is not necessarily the numbers themselves. It is how those numbers can be interpreted.
| Traditional Scoreboard | Data-Focused Match View |
| Shows current score | Helps interpret scoring patterns |
| Shows wickets | Shows when and how wickets affected momentum |
| Shows individual runs | Adds strike-rate and situation-based context |
| Shows bowling figures | Helps compare economy and pressure |
| Shows required rate | Connects it with wickets and remaining overs |
| Shows partnerships | Helps identify important phases |
| Shows match status | Helps explain possible momentum changes |
The traditional scoreboard is therefore not outdated. It is the foundation.
Additional data simply provides another layer of understanding.
Run Rate Gives More Meaning to the Score
Looking at the total score alone can sometimes be misleading.
Suppose Team A reaches 120 runs after 15 overs. That number means more when you know the scoring rate and the number of wickets remaining.
Run rate helps explain how quickly a team is scoring.
For example:
120 runs in 15 overs = 8 runs per over.
If the team needs 180 from 20 overs, the current rate and remaining requirement can be compared to understand the difficulty of the chase.
This makes run rate one of the most useful pieces of context during a limited-overs match.
Required Run Rate Shows the Pressure of a Chase
Required run rate, often called the asking rate, tells us how many runs per over the chasing team needs to score to reach its target within the remaining overs.
Imagine a team needs:
60 runs from 30 balls.
The required rate is:
12 runs per over.
Now consider a batter scoring at a strike rate of 100.
That batter may have a respectable individual score, but the team could still be falling behind the required rate.
This is why individual statistics should not always be viewed independently.
Strike Rate Needs Match Context
Strike rate is a useful measure of scoring speed. It is calculated using runs scored and balls faced.
But a high strike rate does not automatically mean a batter played the most valuable innings.
For example, scoring 30 from 15 balls gives a strike rate of 200.
That sounds excellent.
But imagine the same batter enters when the team needs only 35 runs from 60 balls. The situation is completely different.
Now imagine a batter scoring 45 from 30 balls while the team needs runs quickly during a difficult chase.
The second innings could potentially be more important despite having a lower strike rate.
This is why modern cricket analysis looks at statistics together rather than treating one number as the complete story.
Partnerships Reveal What the Scoreboard Can Hide
A scoreboard shows individual scores, but partnerships can explain how an innings was constructed.
Consider two innings:
Team A:
Batter 1 – 70
Batter 2 – 5
Others – 80
Team B:
Batter 1 – 45
Batter 2 – 42
Others – 73
Both teams could have similar totals.
But the pattern of scoring is different.
The first team may have depended heavily on one batter, while the second team may have built a more balanced innings.
Looking at partnership sizes and the timing of wickets can therefore reveal important information that a simple team total does not immediately communicate.
Fall of Wickets Can Explain Momentum
One of the most useful areas for deeper cricket analysis is the fall-of-wickets pattern.
Suppose a team is:
110/2 after 15 overs
and then becomes:
125/6 after 18 overs.
The final score might not immediately explain what happened.
The fall-of-wickets sequence shows that the team experienced a sudden collapse.
That changes the interpretation of the innings.
Instead of simply saying the team scored slowly, we can identify a specific period where momentum shifted.
Bowling Economy Adds Another Layer
A bowler’s economy rate represents the average number of runs conceded per over.
But even economy rate becomes more useful when viewed alongside match conditions.
For example:
- Was the bowler operating during the powerplay?
- Were they bowling at the death?
- Were wickets falling at the other end?
- Did the bowler create pressure without taking wickets?
- Was the pitch helping the bowling side?
A bowler conceding 8 runs per over during an aggressive phase may have performed differently from someone conceding the same rate when the batting side was simply rotating the strike.
Numbers become more meaningful when their context is understood.
Data Can Help Identify Momentum Changes
Cricket momentum is difficult to describe with one statistic.
It can be influenced by:
- Consecutive boundaries
- Dot-ball sequences
- Wickets
- Partnerships
- Required run rate
- Bowling changes
- Scoring acceleration
- Batting collapses
- Powerplay performance
- Death-over scoring
For example, a team may score only 35 runs in five overs but lose no wickets. Later, it may score 55 runs in the next five overs.
The overall score does not fully communicate the change in attacking intent.
A data-focused view can help break the innings into phases and show where the scoring pattern changed.
Why Multiple Metrics Are Better Than One
One of the biggest advantages of deeper cricket data is the ability to compare multiple statistics.
Consider a batter with:
Runs: 50
Balls: 40
Strike Rate: 125
That is useful information.
Now add:
Team Run Rate: 8.5
Required Run Rate: 11.5
Wickets Remaining: 3
The picture changes.
The batter’s 125 strike rate may be respectable in isolation, but the team may still need significantly faster scoring.
This illustrates an important principle:
A cricket statistic should be interpreted according to the situation in which it was produced.
Tiger365 and the Modern Cricket Data Experience
Modern cricket fans increasingly expect more than a final score.
They want to understand:
- What is happening right now?
- Which team has momentum?
- Which batter is accelerating?
- Which bowler is controlling the scoring?
- How difficult is the current chase?
- When did the match situation change?
- Which statistics explain the current position?
This is where a platform such as Tiger365 can fit into a broader data-focused cricket experience.
The value of live data is not simply showing more numbers. The real value comes from making those numbers easier to understand.
Traditional Scoreboard or Data-Driven View: Which Is Better?
The answer depends on what the user wants.
For a quick match update
A traditional scoreboard is usually enough.
You can immediately see:
Runs + Wickets + Overs + Target
and understand the basic match position.
For deeper analysis
Additional data becomes more useful.
A fan can examine:
Strike Rate + Run Rate + Required Rate + Partnerships + Wickets + Economy + Match Phase
Together, these metrics provide a much richer picture.
So it is not really a competition between traditional scoreboards and modern data.
The best approach is to use the scoreboard as the foundation and additional statistics as the context.
What Cricket Fans Should Look at During a Live Match
If you want to understand a match more deeply, start with these five areas:
1. Current Score
Know the basic position first.
2. Overs and Run Rate
Understand how quickly the team is scoring.
3. Wickets
A team with wickets in hand can have a very different position from a team with the same score but fewer wickets remaining.
4. Required Run Rate
During a chase, compare the current scoring rate with the rate required to reach the target.
5. Partnerships and Recent Momentum
Look at who is batting together, when wickets have fallen and whether the scoring rate has recently changed.
This simple framework can turn a basic scoreboard into a much more informative match-reading experience.
Final Thoughts
Traditional cricket scoreboards remain essential because they provide the basic facts of a match quickly and clearly.
But modern cricket data can add another layer.
Instead of looking only at how many runs have been scored, fans can explore how those runs were scored, when the scoring rate changed, how wickets affected the innings and whether the current situation matches the team’s required rate.
That is the real difference between raw numbers and meaningful context.
For Tigerexch365 the opportunity is to focus on helping cricket fans understand data rather than simply presenting more statistics. When scorecards, live numbers and match context are brought together, following a cricket match can become a much more informed experience.
FAQ
What is the difference between a cricket scoreboard and cricket data analysis?
A scoreboard provides the basic match position, while data analysis connects multiple statistics to explain performance, pressure and momentum.
Why is required run rate important in cricket?
Required run rate shows the scoring rate a chasing team needs to maintain to reach its target within the remaining overs.
Does strike rate tell the complete story of a batter’s performance?
No. Strike rate should be considered alongside the match situation, wickets, required rate, partnership and stage of the innings.
How do partnerships help with cricket analysis?
Partnership statistics show how batters contributed together and can reveal important periods of stability or acceleration.
What does fall of wickets tell cricket fans?
It shows when wickets were lost and can help identify collapses, pressure periods and changes in innings momentum.
Why is bowling economy important?
Economy rate indicates how many runs a bowler concedes per over and can help evaluate their control during different phases of an innings.
What is cricket match momentum?
Match momentum describes changes in the balance of a game based on factors such as wickets, scoring rate, partnerships, boundaries and bowling pressure.
Why should cricket statistics be viewed together?
Individual statistics can be misleading without context. Combining several metrics provides a more complete picture of a team’s or player’s performance.
Can live cricket data improve match understanding?
Yes. Real-time statistics can help fans follow scoring patterns, wickets, required rates and other changes as the match develops.
Is a traditional cricket scoreboard still useful?
A traditional cricket scoreboard is still useful because it quickly shows essential information such as runs, wickets, overs, and batsmen’s scores.